

Ask an owner for their financials and you will usually get two things: a profit and loss statement, and a balance sheet. Both are useful. Neither, on its own, tells you what happened to the business.
There are five statements, not two, and the reason there are five is that a business can only be described from more than one angle at once. Profitable and short of cash is not a contradiction. Growing and getting weaker is not a contradiction. Each of those sentences is true on one statement and invisible on another, which is exactly why the five exist and why they are read together.
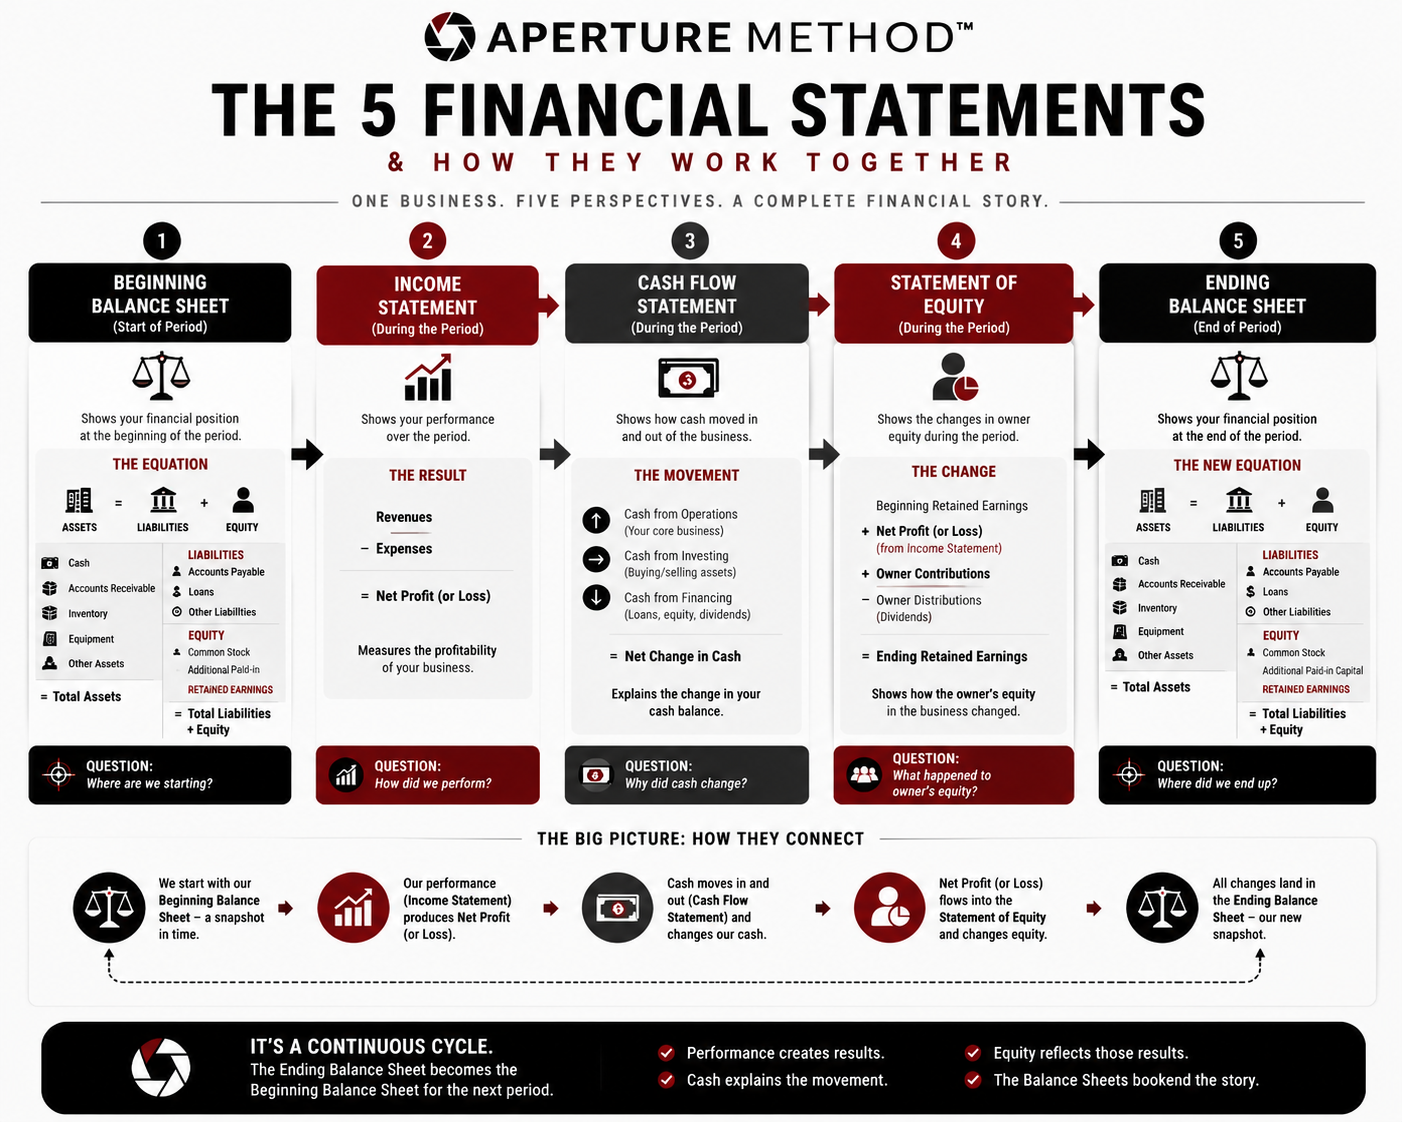
Here is the whole picture on one page.
Beginning Balance Sheet
Start of period
Shows your financial position at the beginning of the period.
The equation
Assets = Liabilities + Equity
Assets
- Cash
- Accounts Receivable
- Inventory
- Equipment
- Other Assets
= Total Assets
Liabilities
- Accounts Payable
- Loans
- Other Liabilities
Equity
- Common Stock
- Additional Paid-in Capital
- Retained Earnings
= Total Liabilities + Equity
Question
Where are we starting?
Income Statement
During the period
Shows your performance over the period.
The result
- Revenues
- −Expenses
= Net Profit (or Loss)
Measures the profitability of your business.
Question
How did we perform?
Cash Flow Statement
During the period
Shows how cash moved in and out of the business.
The movement
- ↑Cash from OperationsYour core business
- →Cash from InvestingBuying and selling assets
- ↓Cash from FinancingLoans, equity, dividends
= Net Change in Cash
Explains the change in your cash balance.
Question
Why did cash change?
Statement of Equity
During the period
Shows the changes in owner equity during the period.
The change
- Beginning Retained Earnings
- +Net Profit (or Loss)from the Income Statement
- +Owner Contributions
- −Owner DistributionsDividends
= Ending Retained Earnings
Shows how the owner's equity in the business changed.
Question
What happened to owner's equity?
Ending Balance Sheet
End of period
Shows your financial position at the end of the period.
The new equation
Assets = Liabilities + Equity
Assets
- Cash
- Accounts Receivable
- Inventory
- Equipment
- Other Assets
= Total Assets
Liabilities
- Accounts Payable
- Loans
- Other Liabilities
Equity
- Common Stock
- Additional Paid-in Capital
- Retained Earnings
= Total Liabilities + Equity
Question
Where did we end up?
The big picture: how they connect
- 1We start with the Beginning Balance Sheet, a snapshot in time.
- 2Our performance, the Income Statement, produces Net Profit or Loss.
- 3Cash moves in and out, the Cash Flow Statement, and changes our cash.
- 4Net Profit or Loss flows into the Statement of Equity and changes equity.
- 5All the changes land in the Ending Balance Sheet, our new snapshot.
It is a continuous cycle.
The Ending Balance Sheet becomes the Beginning Balance Sheet for the next period.
- Performance creates results.
- Cash explains the movement.
- Equity reflects those results.
- The Balance Sheets bookend the story.
Five questions, in order
The sequence is not arbitrary. Each statement answers one question, and it answers it in a specific order. Where are we starting. How did we perform. Why did cash change. What happened to the owner's equity. Where did we end up. Read in that order, the five stop being five documents and become one story with a beginning and an end.
The two balance sheets bookend the period. Everything between them is the explanation. The income statement explains performance, the cash flow statement explains movement, and the statement of equity explains what the owner's stake did while all that was going on. Then the ending balance sheet becomes the beginning balance sheet of the next period, and it runs again.
Profitable and short of cash is not a contradiction. It is two different statements telling the truth about the same month.
The one most often missing
In practice the cash flow statement is the one that does not turn up. It is the least likely to be produced by a small accounting package by default, the least likely to be asked for by a bank that already has the other two, and by some distance the most useful of the three when a business feels tight.
Without it, several things stop being measurable and start being estimated. Depreciation and capital spending have to be inferred. The movement in working capital, the money quietly tied up in stock and in customers who have not paid yet, cannot be separated from trading at all. Cash conversion, which is simply how much of the profit on the page turned into money in the account, cannot be calculated. Those are not exotic measures. They are the ones that explain why a good year did not feel like one.
Why we ask for four balance sheets, not three
This is the question we get most often when an engagement starts, so here is the plain answer. Any measure calculated against an average balance, days sales outstanding, inventory days, return on assets, needs an opening balance as well as a closing one. Four balance sheet dates produce three years of those ratios. Three dates produce two.
It is one extra document and it buys a third data point on every trend that matters. Two points make a line. Three make a direction.
What to do with this
If you only ever look at one thing, look at the bottom of the cash flow statement next to the bottom of the income statement, for the same period. Profit and net change in cash should tell a similar story. When they do not, the gap between them is where your business actually is, and the reason for the gap is almost always sitting in working capital, in capital spending, or in what was taken out.
None of this requires a finance background. It requires the five statements in front of you at the same time, in the right order, which is the point of the graphic above. Print it. It is the same map we work from.
General information, not accounting advice. Presentation and terminology vary by entity type and by the basis your accounts are prepared on.
